Interstate Sailing Incorporated
Strip Chart
EXPEDITION STRIP CHART

During the race, the Expedition Strip Chart is used to track recent or long term changes in data such as True Wind Direction or True Wind Speed. These are quite important trends if the tactician is expecting a persistent shift or if an approaching front or system is expected to bring strong winds. With Expedition Strip Chart the past will help you predict the future!
The Expedition Strip Chart is also used for real-time performance analysis. For example, changes in trim, helm, True Wind Angle, sail configuration, etc are noted as an event and the navigator performs an analysis of speed or VMG before and after the event. With Strip Chart there is no more guessing about which sail was faster or which helmsman made a better VMG. The numbers don't lie!
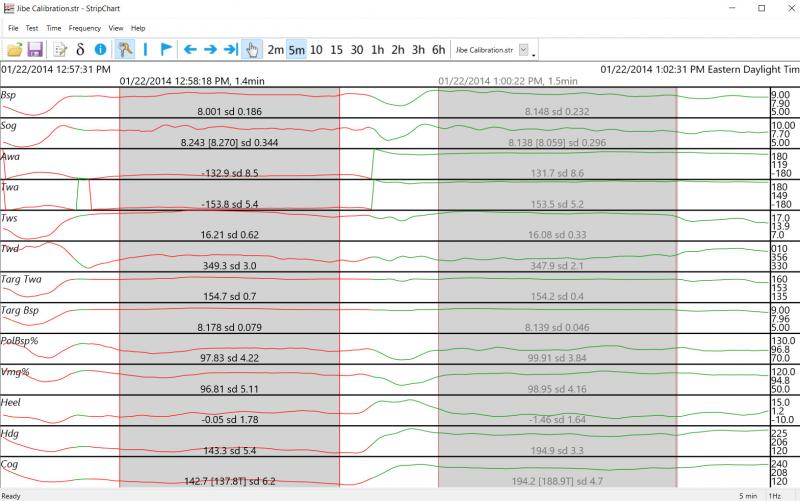
BELOW - CALIBRATION CHECK
A good post-race analysis (and pre-race routine) includes a check of your calibration. In the example below, the navigator created two tests to check the downwind calibration under the A2. Note that BSP, AWA, TWA, TWS, TWD are all consistent from one jibe to the other and the compass also looks well-calibrated as HDG matches COG.
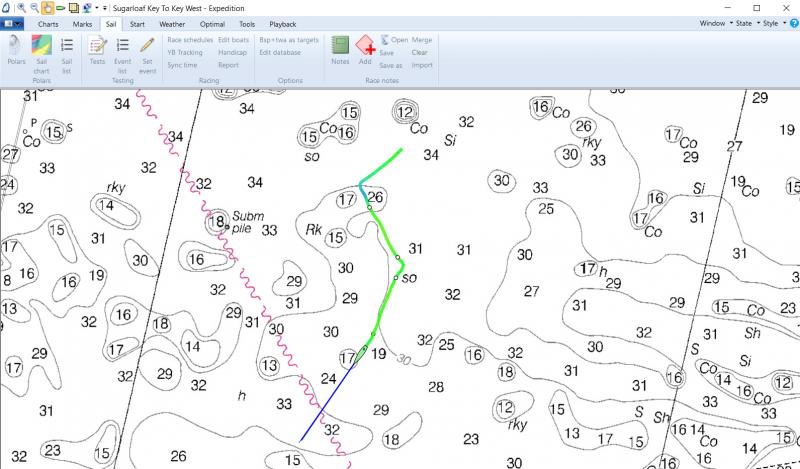
BELOW - TESTS SHOWN ON GPS TRACK
Expedition has an added feature that shows the location of your Strip Chart tests on your GPS track. Note the small circles on the track segments before and after the most recent jibe. These help you to pinpoint exactly what was happening in the race during your test and can help to show the effects of sailing near headlands or other geographic features that may influence local winds.
Expedition smoothly integrates with Race Replay for further in-depth performance analysis. Contact Us with questions about how to refine your polars and calibration.


Interstate Sailing Incorporated